Plot velocity vectors

General scientific issues regarding ROMS

Moderators: arango, robertson

Post Reply
Message
Author
liangliang
Posts: 61
Joined: Mon Jul 20, 2009 2:41 pm
Location: Port And Costal Engineering Laboratory

Plot velocity vectors

#1 Unread post by liangliang »

i have got the ocean_his.nc. i want to get the vector of current.And I use wilkin's roms_quivergrd.m
to plot velocity vectors . But matlab shows an error .
Error using +
Matrix dimensions must agree.
Error in roms_quivergrd (line 96)
uveitheta = (u+sqrt(-1)*v).*exp(sqrt(-1)*angle);

Easygrid can generated spherical grid ,but my grid is Cartesian. I changed some codes and generated the grid.
X = 1200;
Y = 1200;
rotangle = 0; % Angle (degrees) to rotate the grid conterclock-wise
resol = 20; % Cell width and height
N = 10;
x = 0:resol:X; Lm = length(x)-2; Lp= Lm +2; L = Lp-1;
y = 0:resol:Y; Mm = length(y)-2; Mp= Mm +2; M = Mp-1;
x_rho = ones(length(y),1)*x(:)';
y_rho = y(:)*ones(1,length(x));
x_u = (x_rho(:,1:L) + x_rho(:,2:Lp))/2;
y_u = (y_rho(:,1:L) + y_rho(:,2:Lp))/2;
x_v = (x_rho(1:M,:) + x_rho(2:Mp,:))/2;
y_v = (y_rho(1:M,:) + y_rho(2:Mp,:))/2;


Could somebody tell me what's wrong with it ? How could i plot vector of current? Thank you !

MY GRID
grd_file: 'C:\Users\Administrator\Desktop\roms-result\ocean_his_2.nc'
mask_rho: [61x61 double]
mask_psi: [60x60 double]
mask_u: [61x60 double]
mask_v: [60x61 double]
h: [61x61 double]
pm: [61x61 double]
pn: [61x61 double]
f: [61x61 double]
angle: [61x61 double]
x_rho: [61x61 double]
y_rho: [61x61 double]
x_u: [61x60 double]
y_u: [61x60 double]
x_v: [60x61 double]
y_v: [60x61 double]
x_psi: [60x60 double]
y_psi: [60x60 double]
lon_rho: [61x61 double]
nolatlon: 1
lat_rho: [61x61 double]
lon_psi: [60x60 double]
lat_psi: [60x60 double]
lon_v: [60x61 double]
lat_v: [60x61 double]
lon_u: [61x60 double]
lat_u: [61x60 double]
mask_rho_nan: [61x61 double]
zeta: [61x61 double]
z_r: [10x61x61 double]
z_w: [11x61x61 double]
Vtransform: 2
Vstretching: 4
theta_s: 7
theta_b: 2
Tcline: 250
N: 10
hc: 250
sc_w: [-1 -0.9 -0.8 -0.7 -0.6 -0.5 -0.4 -0.3 -0.2 -0.1 0]
Cs_w: [1x11 double]
sc_r: [-0.95 -0.85 -0.75 -0.65 -0.55 -0.45 -0.35 -0.25 -0.15 -0.05]
Cs_r: [1x10 double]
s_w: [-1 -0.9 -0.8 -0.7 -0.6 -0.5 -0.4 -0.3 -0.2 -0.1 0]
s_rho: [-0.95 -0.85 -0.75 -0.65 -0.55 -0.45 -0.35 -0.25 -0.15 -0.05]
Image

edwardrivera
Posts: 11
Joined: Wed Apr 24, 2013 11:08 am
Location: CariCOOS

Re: Plot velocity vectors

#2 Unread post by edwardrivera »

Well, I don’t use any post-processing routine from ROMS but if you want to get a velocity plot with matlab is quite simple with the quiver function. You could do something like this:

quiver(lon_rho,lat_rho,u_eastward( : , : , ‘level’, ‘time’), v_northward( : , : , ‘level’, ‘time’))

Where u_eastward and v_northward are the u- and v- velocity components at RHO points and ‘level’is the vertical level of interest. As you see, I already have both components at RHO points which could be easily done by modifying the input file. But if you forgot do so, you could interpolate the velocity fields (u and v) at u, v or rho points.

miguel.solano
Posts: 12
Joined: Mon Jan 30, 2012 8:02 pm
Location: University of Texas at Dallas

Re: Plot velocity vectors

#3 Unread post by miguel.solano »

Try putting a dot before the multiplication in {sqrt(-1)*v}
So it should look like {sqrt(-1).*v}
I think the reason dimensions do not agree is because you are doing a matrix multiplication of a single value and a matrix instead of an element-wise (or point-wise) multiplication of the matrix with the element {sqrt(1)}, so when matlab tries to sum up u and v these won't have the same dimensions. I always find it useful to check variable dimensions to double check all operations are carried out correctly.
Last edited by miguel.solano on Sun Aug 04, 2013 2:44 pm, edited 1 time in total.

rduran
Posts: 152
Joined: Fri Jan 08, 2010 7:22 pm
Location: Theiss Research

Re: Plot velocity vectors

#4 Unread post by rduran »

The reason dimensions do not agree is because you are doing a matrix multiplication of a single value and a matrix instead of an element-wise (or point-wise) multiplication of the matrix with the element {sqrt(1)}
not true

liangliang
Posts: 61
Joined: Mon Jul 20, 2009 2:41 pm
Location: Port And Costal Engineering Laboratory

Re: Plot velocity vectors

#5 Unread post by liangliang »

miguel.solano wrote:Try putting a dot before the multiplication in {sqrt(-1)*v}
So it should look like {sqrt(-1).*v}
I think the reason dimensions do not agree is because you are doing a matrix multiplication of a single value and a matrix instead of an element-wise (or point-wise) multiplication of the matrix with the element {sqrt(1)}, so when matlab tries to sum up u and v these won't have the same dimensions. I always find it useful to check variable dimensions to double check all operations are carried out correctly.
Thank you ! I have a try to do it !
It also get an error :
Error in roms_quivergrd (line 96)
uveitheta = (u+sqrt(-1).*v).*exp(sqrt(-1)*angle);

liangliang
Posts: 61
Joined: Mon Jul 20, 2009 2:41 pm
Location: Port And Costal Engineering Laboratory

Re: Plot velocity vectors

#6 Unread post by liangliang »

edwardrivera wrote:Well, I don’t use any post-processing routine from ROMS but if you want to get a velocity plot with matlab is quite simple with the quiver function. You could do something like this:

quiver(lon_rho,lat_rho,u_eastward( : , : , ‘level’, ‘time’), v_northward( : , : , ‘level’, ‘time’))

Where u_eastward and v_northward are the u- and v- velocity components at RHO points and ‘level’is the vertical level of interest. As you see, I already have both components at RHO points which could be easily done by modifying the input file. But if you forgot do so, you could interpolate the velocity fields (u and v) at u, v or rho points.
Thank you , edwardrivera !
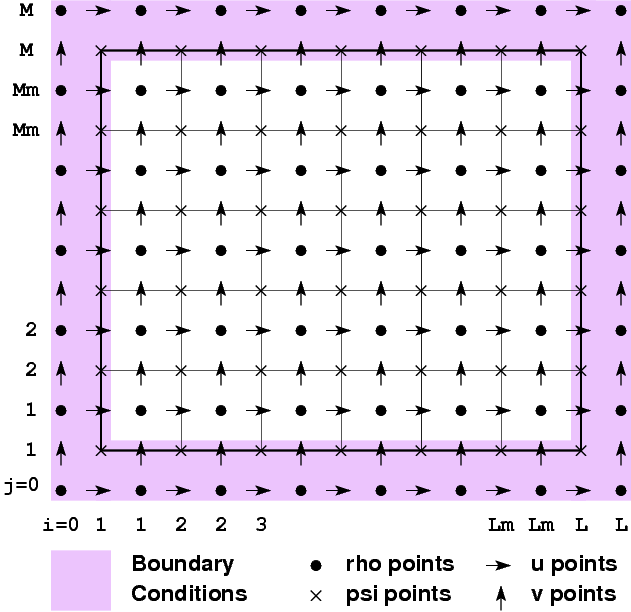
But the number of u points is not equal to rho points. you can find the picture above.
For example , rho points = 61*61
u points = 61*60
v points =60*61
quiver.m needs the size of u points ,v points,rho points are all the same .
How did you do that ? could you give me some advice ?

edwardrivera
Posts: 11
Joined: Wed Apr 24, 2013 11:08 am
Location: CariCOOS

Re: Plot velocity vectors

#7 Unread post by edwardrivera »

I know the u-,v-, and RHO points are not the same. What I was trying to explain is that in the input file there is an option that can be activated in order to save in the history file the u and v fields at rho points so you have both fields at the same points.

Hout(idu3dE) == T ! u_eastward 3D U-eastward at RHO-points
Hout(idv3dN) == T ! v_northward 3D V-northward at RHO-points

If you don't like to do so or you forgot to do it, you could interpolate the V-Field in u-points, U-Field in v-points or both fields in Rho-points. The important part is to have both fields in the same points in the grid. As soon you manage to do it, you could use the Matlab function called quiver as in my previous reply.

User avatar
wilkin
Posts: 922
Joined: Mon Apr 28, 2003 5:44 pm
Location: Rutgers University
Contact:

Re: Plot velocity vectors

#8 Unread post by wilkin »

You don't say how you have read the u,v data you pass to roms_quivergrd, or how you loaded the grd structure. Possibly the u,v data have a leading singleton time dimension or vertical dimension, in which case having 3 or 4 dimensions is inconsistent with angle, which has 2 dimensions. If this is the case, squeeze(u) first.

My code assumes that when u,v are read from the nc file they have dimensions in the order [time,s,j,i]. This is how nc_varget returns data. If you have read them with some other code you might have them transposed.

The grd structure, if read from the history file, should have all the correct data needed in the correct format, because they are passed through by ROMS. How did you generate grd?

To debug this, set a stop in roms_quivergrd with the Matlab debugger and find out the dimensions that are causing the mis-match. You can either set a stop point in the code just before where it throws the error, or catch all errors in your session with:

>> dbstop if error

If the error persists, place the history file somewhere I can access it and I will debug for you.
John Wilkin: DMCS Rutgers University
71 Dudley Rd, New Brunswick, NJ 08901-8521, USA. ph: 609-630-0559 jwilkin@rutgers.edu

liangliang
Posts: 61
Joined: Mon Jul 20, 2009 2:41 pm
Location: Port And Costal Engineering Laboratory

Re: Plot velocity vectors

#9 Unread post by liangliang »

wilkin wrote:You don't say how you have read the u,v data you pass to roms_quivergrd, or how you loaded the grd structure. Possibly the u,v data have a leading singleton time dimension or vertical dimension, in which case having 3 or 4 dimensions is inconsistent with angle, which has 2 dimensions. If this is the case, squeeze(u) first.

My code assumes that when u,v are read from the nc file they have dimensions in the order [time,s,j,i]. This is how nc_varget returns data. If you have read them with some other code you might have them transposed.

The grd structure, if read from the history file, should have all the correct data needed in the correct format, because they are passed through by ROMS. How did you generate grd?

To debug this, set a stop in roms_quivergrd with the Matlab debugger and find out the dimensions that are causing the mis-match. You can either set a stop point in the code just before where it throws the error, or catch all errors in your session with:

>> dbstop if error

If the error persists, place the history file somewhere I can access it and I will debug for you.
Hi wilkin ,
You are very kindness , Thank for your help !
I regenerated my grid by easygrid . It's spherical. If I plot result file ,matlab still shows an error. You can find the result file at attachment.

Setting in easygrid
lat = 0; % Latitude (degrees) of the bottom-left corner of the grid.
lon = 0; % Longitude (degrees) of the bottom-left corner of the grid.

X = 1180; % Width of domain (meters)
Y = 1200; % Length of domain (meters)
rotangle = 0; % Angle (degrees) to rotate the grid conterclock-wise
resol = 20; % Cell width and height (i.e. Resolution)in meters. Grid cells are forced to be (almost) square.
N = 10; % Number of vertical levels
hh = nan; % Analytical Depth (meters) used to create a uniform-depth grid. If using a bathymetry file, leave hh = nan;
minh = 0; % Arbitrary depth offset in meters (see above). minh should be a little more than the maximum expected tidal variation.
Attachments
ocean_his_2.nc
(9.33 MiB) Downloaded 392 times

User avatar
wilkin
Posts: 922
Joined: Mon Apr 28, 2003 5:44 pm
Location: Rutgers University
Contact:

Re: Plot velocity vectors

#10 Unread post by wilkin »

I don't know what you've done, but dumping the contents of your ocean_his_2.nc for x_rho all values are 0. So that's clearly not going to work for plotting or much else.

ROMS itself only needs the grid metrics pm,pn to run, and those seem OK.
John Wilkin: DMCS Rutgers University
71 Dudley Rd, New Brunswick, NJ 08901-8521, USA. ph: 609-630-0559 jwilkin@rutgers.edu

liangliang
Posts: 61
Joined: Mon Jul 20, 2009 2:41 pm
Location: Port And Costal Engineering Laboratory

Re: Plot velocity vectors

#11 Unread post by liangliang »

wilkin wrote:I don't know what you've done, but dumping the contents of your ocean_his_2.nc for x_rho all values are 0. So that's clearly not going to work for plotting or much else.

ROMS itself only needs the grid metrics pm,pn to run, and those seem OK.
Hi,wilkin
Thank you for your help !
You are right ! I set wrong 'grd' parameter in roms_sview.m. My grid is generated by easygrid. ocean_his_2.nc is my result file ,boshengliu_grd.nc is my grid file.
I set grd=roms_get_grid('ocean_his_2.nc','ocean_his_2.nc') before . grd.lon_u and grd.lon_rho all values are 0 .So it's wrong to use roms_sview to plot vectors.
If I set grd=roms_get_grid('boshengliu_grd.nc'), roms_sview will work well . I can get the velocity vectors.
But I still have two questions . First ,how to change the vector color ? The color
is blue .I want to set it black . What should I do ? Second ,if i want to plot vectoes from (ubar,vbar) ,should i just set var='ubarmag' ?
Thank you !
Chen zhen
vector.png
vector.png (91.16 KiB) Viewed 9588 times

liangliang
Posts: 61
Joined: Mon Jul 20, 2009 2:41 pm
Location: Port And Costal Engineering Laboratory

Re: Plot velocity vectors

#12 Unread post by liangliang »

wilkin wrote:I don't know what you've done, but dumping the contents of your ocean_his_2.nc for x_rho all values are 0. So that's clearly not going to work for plotting or much else.

ROMS itself only needs the grid metrics pm,pn to run, and those seem OK.
Hi wilkin ,
Thank you for your help !I just see the message. But I didn't know how to sent message to you in this forum. So I reply it here .
My grid is spherical . I generate the gird by easygid ,which default 'spherical'=F , so the history file has zero for the x_psi etc. It's my fault.
I changed 'spherical'= T in my grid ,it's OK to use roms_sview to plot .
Thank you again !
Chenzhen

Post Reply