File list
From WikiROMS
Jump to navigationJump to search
This special page shows all uploaded files.
| Date | Name | Thumbnail | Size | User | Description | Versions |
|---|---|---|---|---|---|---|
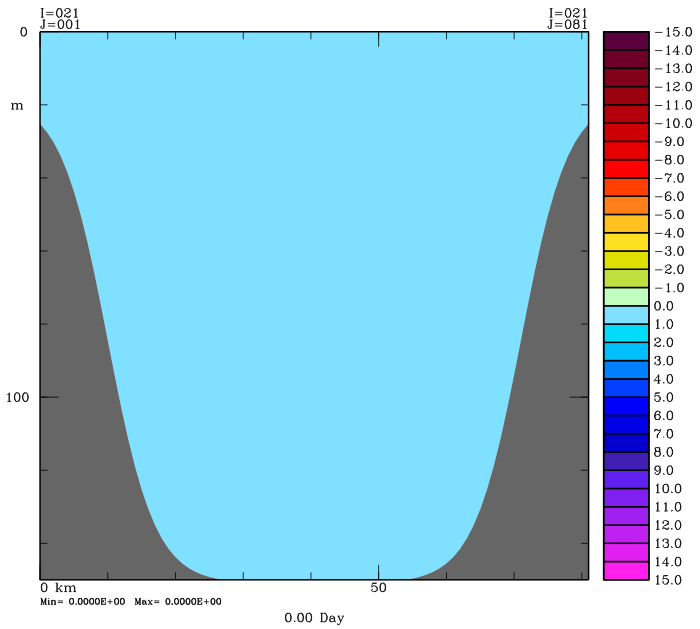
| 15:22, 18 July 2008 | omega his 0.png (file) |  |
21 KB | Robertson | Day 0 from an Upwelling history file. | 1 |
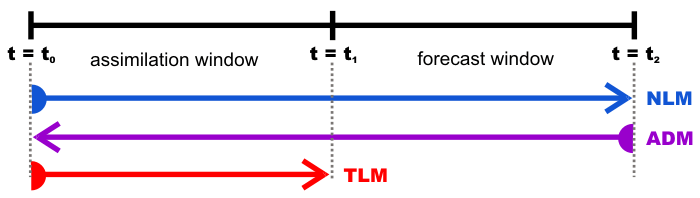
| 17:01, 10 July 2008 | obs sens time diagram.png (file) |  |
10 KB | Robertson | 3 | |
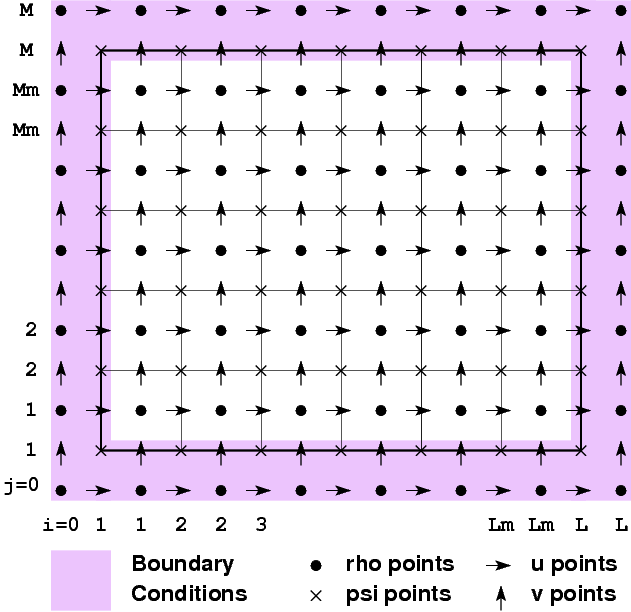
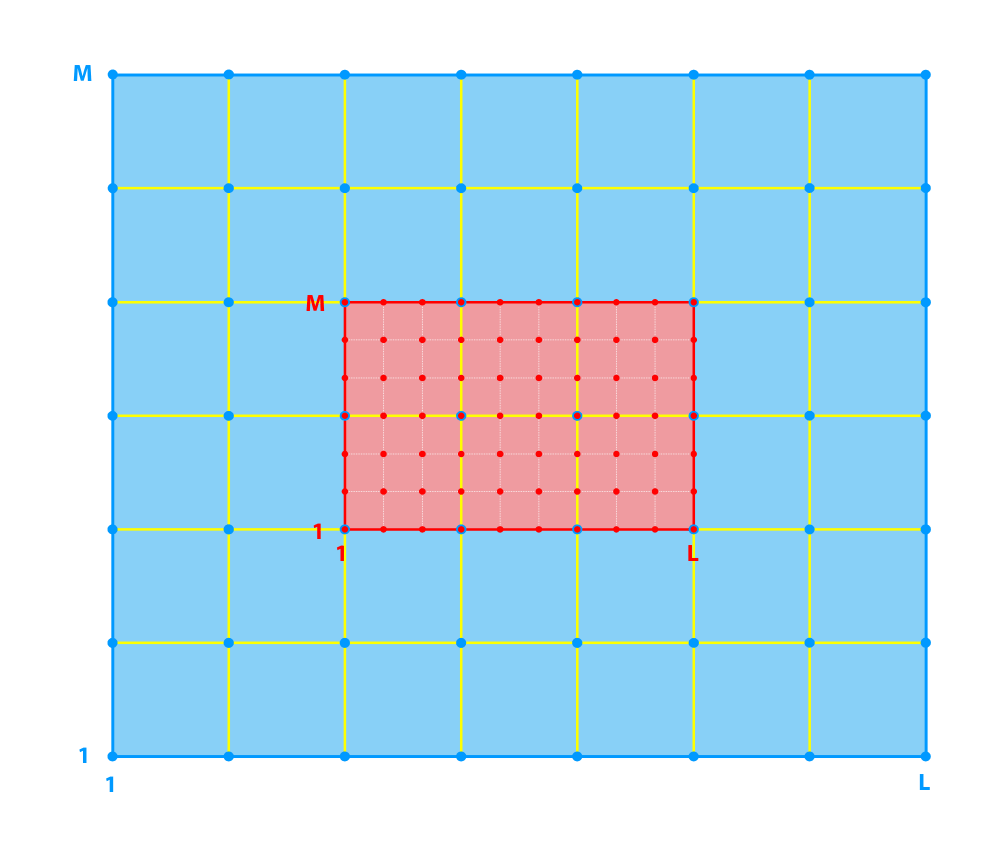
| 22:56, 20 June 2008 | Whole grid.png (file) |  |
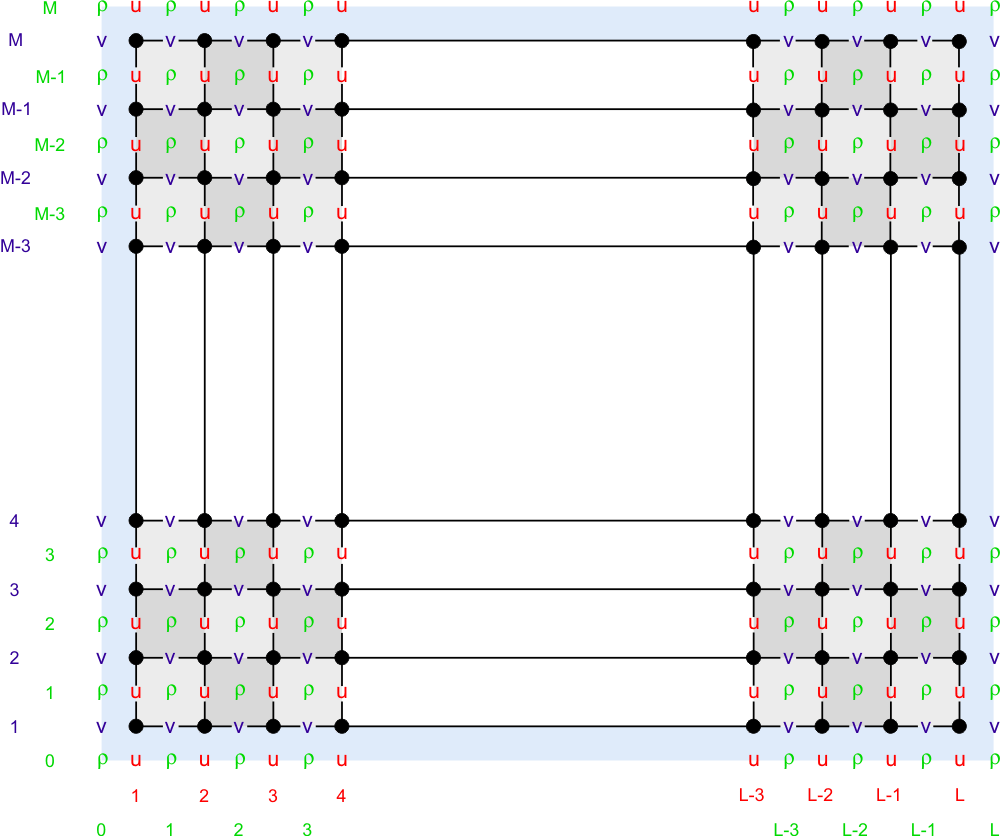
8 KB | Kate | Whole Arakawa C grid | 1 |
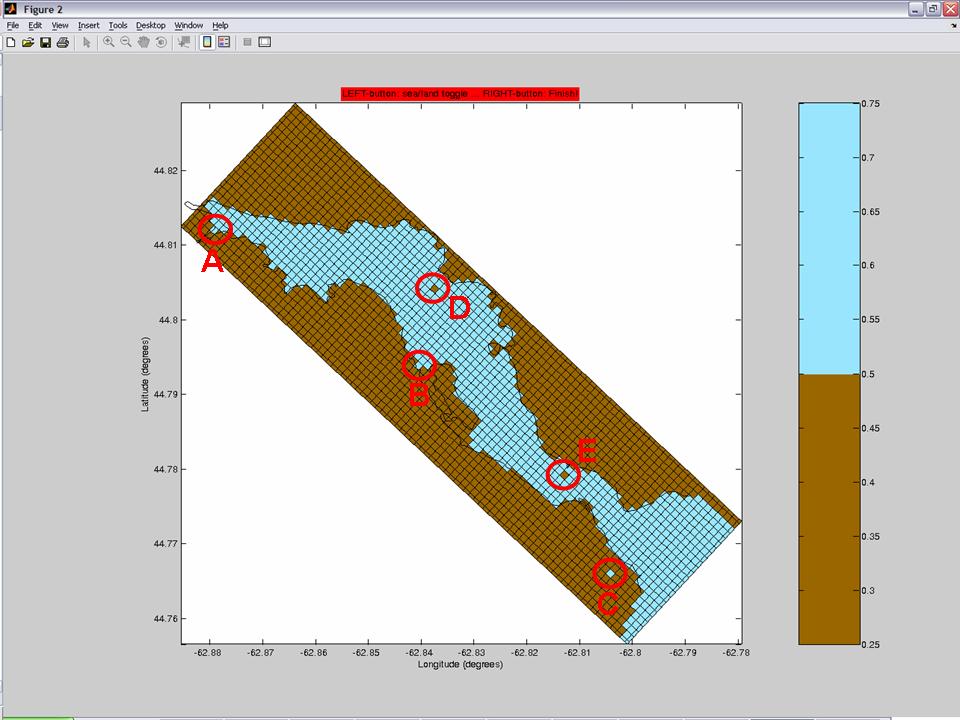
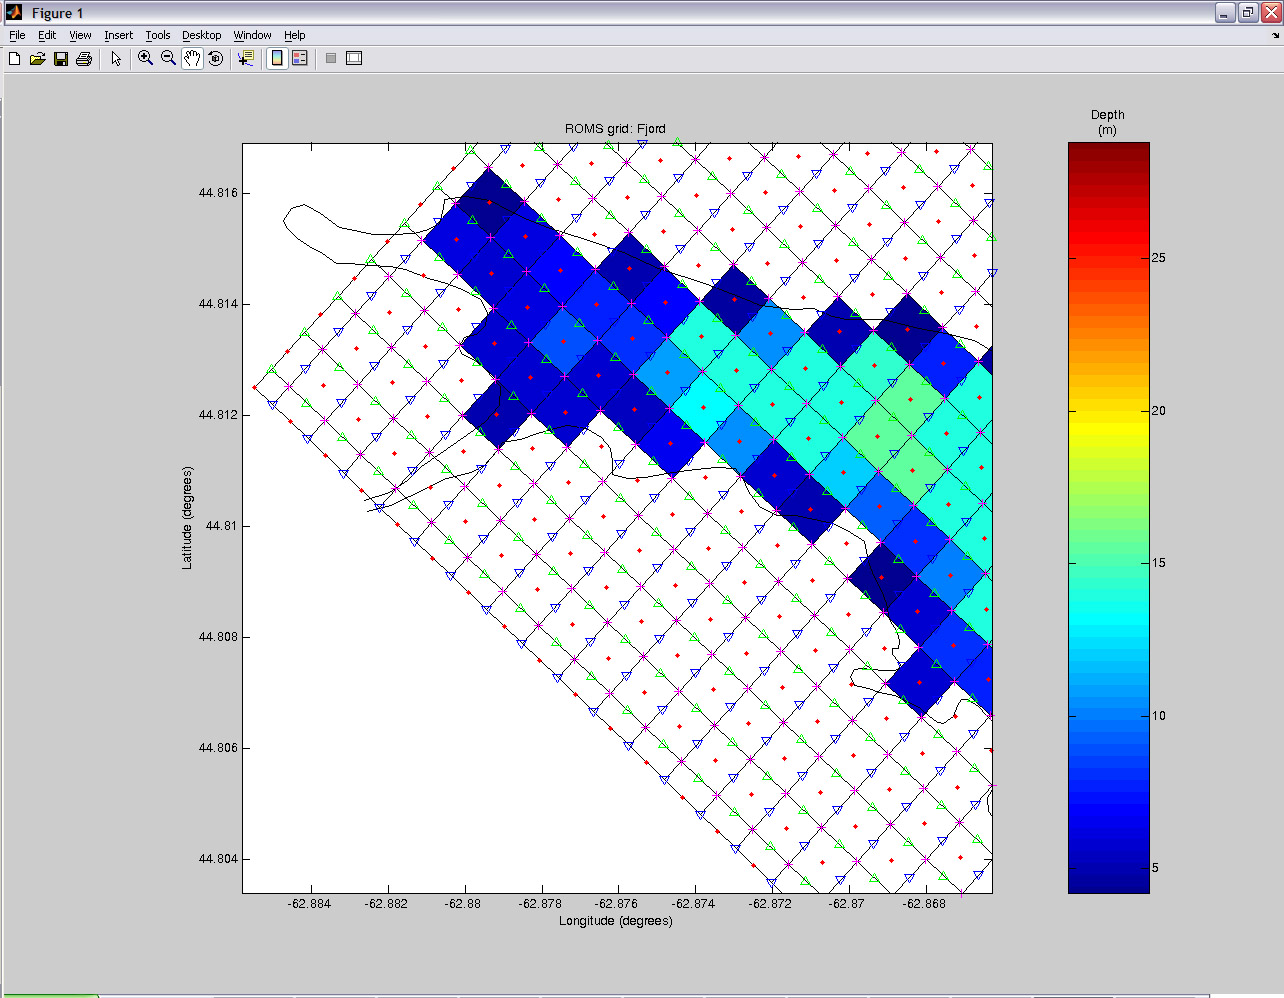
| 01:53, 25 April 2008 | Fjord editmask1.jpg (file) |  |
83 KB | Diego | 2 | |
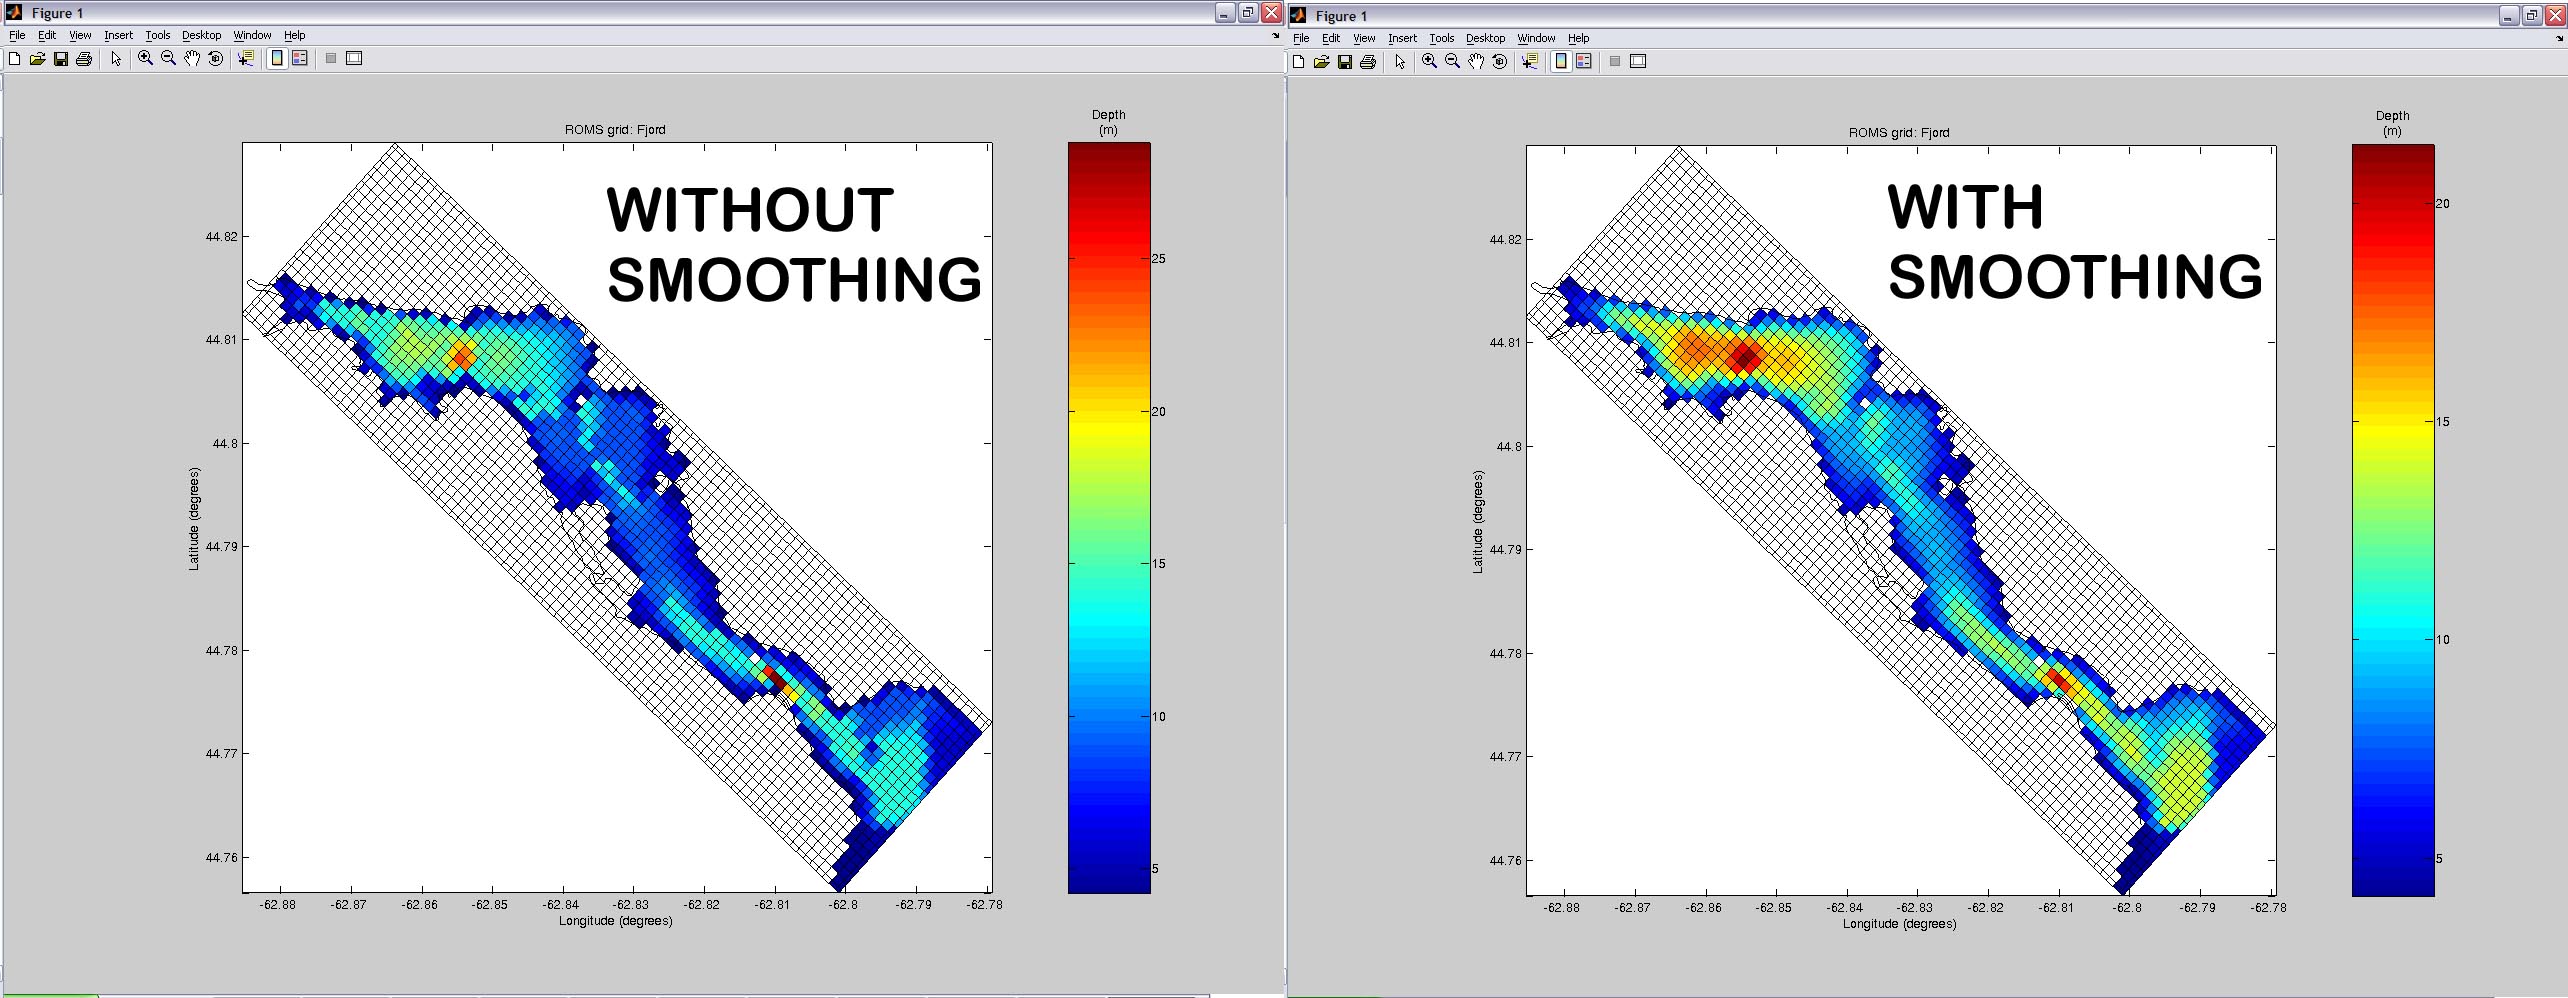
| 20:10, 21 April 2008 | Fjord NOTsmoothNsmooth.jpg (file) |  |
429 KB | Diego | 1 | |
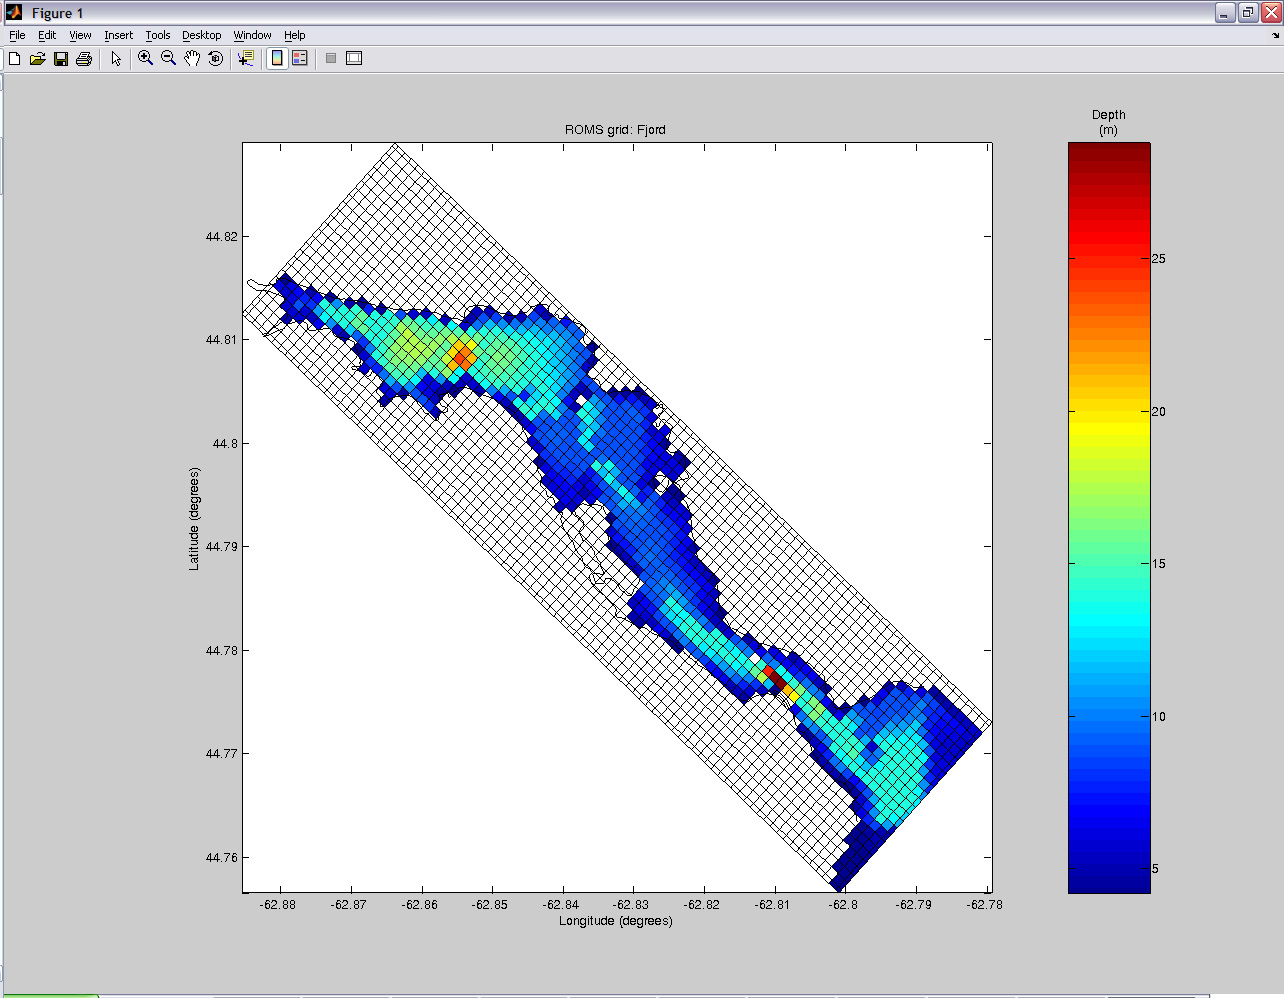
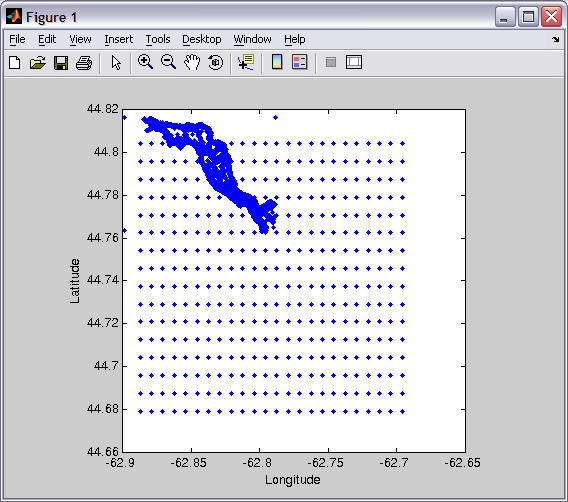
| 19:40, 21 April 2008 | Fjord grid.jpg (file) |  |
373 KB | Diego | 1 | |
| 19:28, 21 April 2008 | Fjord NOTsmooth.jpg (file) |  |
332 KB | Diego | 1 | |
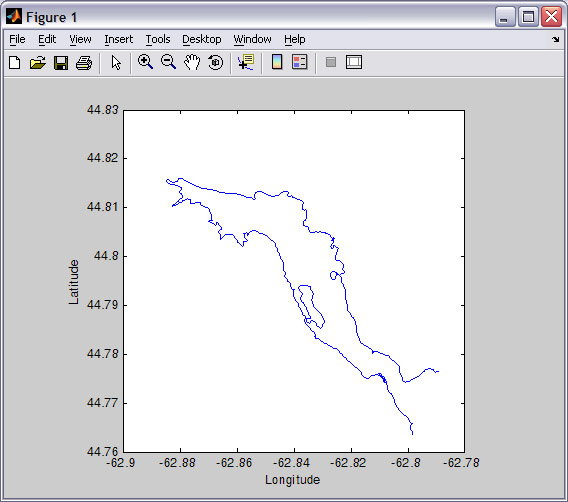
| 19:02, 21 April 2008 | Fjord coast.jpg (file) |  |
71 KB | Diego | 1 | |
| 18:37, 21 April 2008 | Fjord latlon.jpg (file) |  |
211 KB | Diego | 1 | |
| 19:56, 9 April 2008 | Test case4 fig1.gif (file) |  |
16 KB | Etwomey | 1 | |
| 19:56, 9 April 2008 | Test case 4.gif (file) |  |
4 KB | Etwomey | 1 | |
| 15:58, 9 April 2008 | Test case3 fig3.gif (file) |  |
20 KB | Etwomey | 2 | |
| 15:57, 9 April 2008 | Test case3 fig2.gif (file) |  |
15 KB | Etwomey | 1 | |
| 15:57, 9 April 2008 | Test case3 fig1.gif (file) |  |
7 KB | Etwomey | 1 | |
| 15:56, 9 April 2008 | Test case 3.gif (file) |  |
5 KB | Etwomey | 1 | |
| 15:55, 8 April 2008 | Estuary 4panel sed.gif (file) |  |
23 KB | Etwomey | 1 | |
| 15:55, 8 April 2008 | Estuary 4panel salt.gif (file) |  |
21 KB | Etwomey | 1 | |
| 15:55, 8 April 2008 | Fig1.gif (file) |  |
5 KB | Etwomey | 1 | |
| 15:55, 8 April 2008 | Test case 2.gif (file) |  |
4 KB | Etwomey | 1 | |
| 14:41, 8 April 2008 | Test chan.gif (file) |  |
29 KB | Etwomey | 2 | |
| 14:18, 8 April 2008 | Sed test1.gif (file) |  |
29 KB | Etwomey | 1 | |
| 20:11, 7 April 2008 | Jw eq 1 E.gif (file) | 1 KB | Etwomey | 1 | ||
| 20:04, 7 April 2008 | Equation ustar.gif (file) |  |
1 KB | Etwomey | 1 | |
| 18:37, 7 April 2008 | Test case 1.gif (file) |  |
5 KB | Etwomey | 2 | |
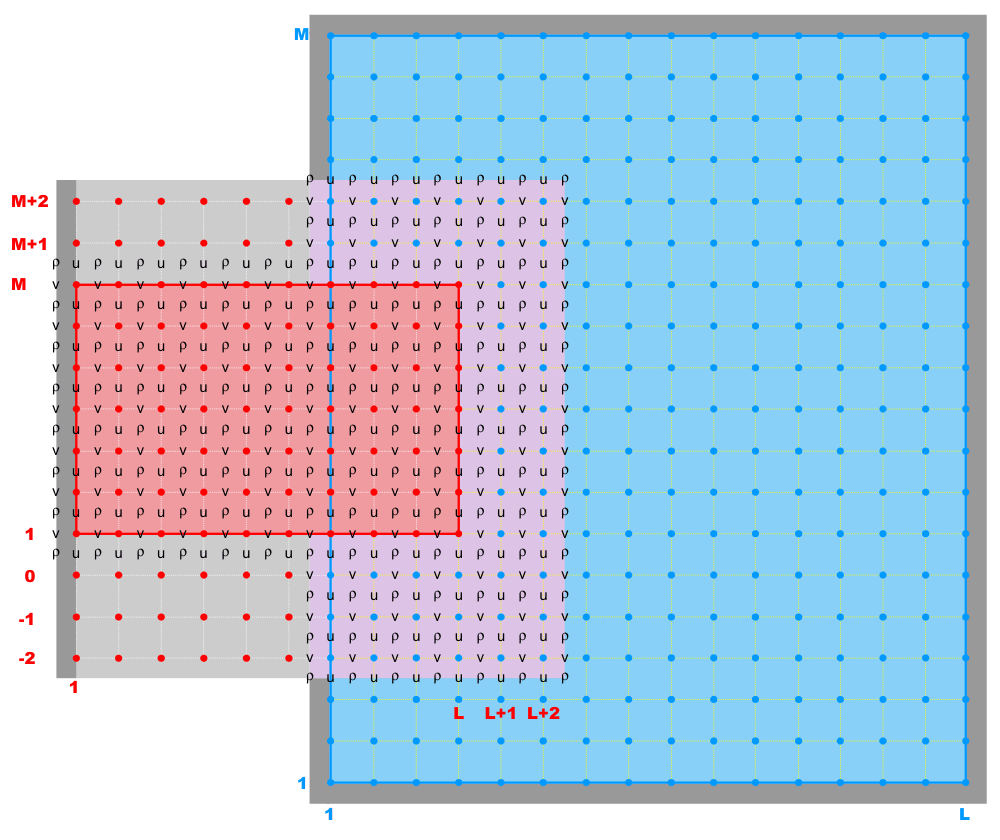
| 13:11, 1 April 2008 | composite grid1.png (file) |  |
78 KB | Robertson | 1 | |
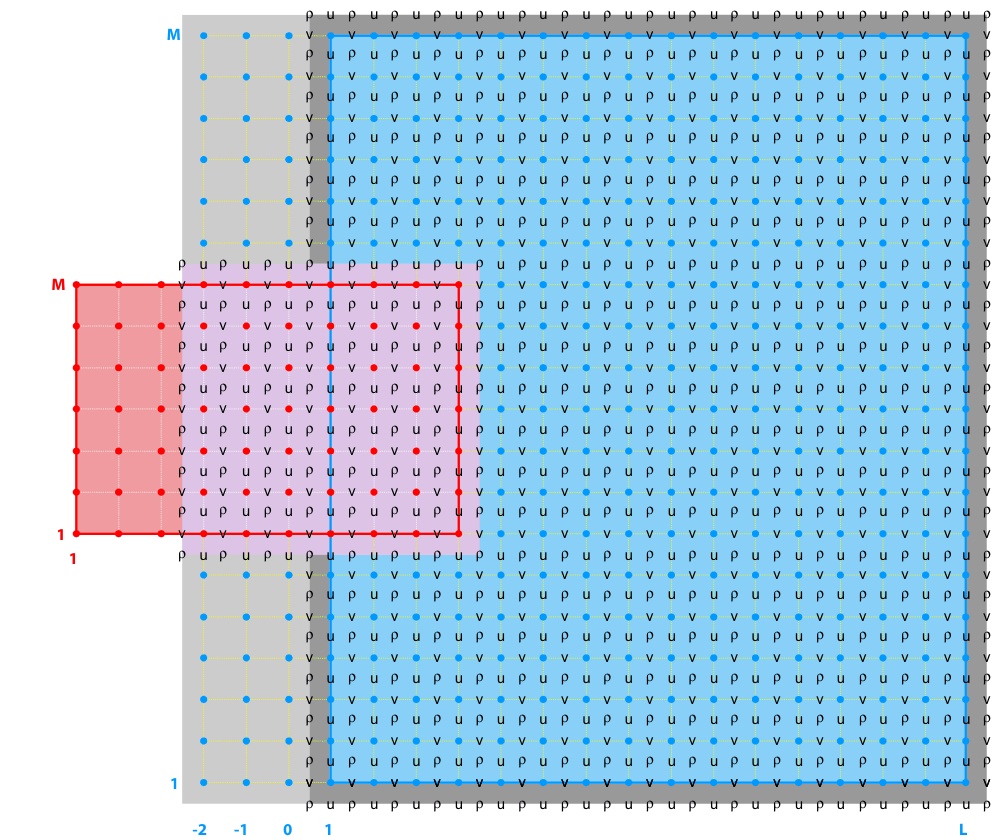
| 13:11, 1 April 2008 | composite grid2.png (file) |  |
103 KB | Robertson | 1 | |
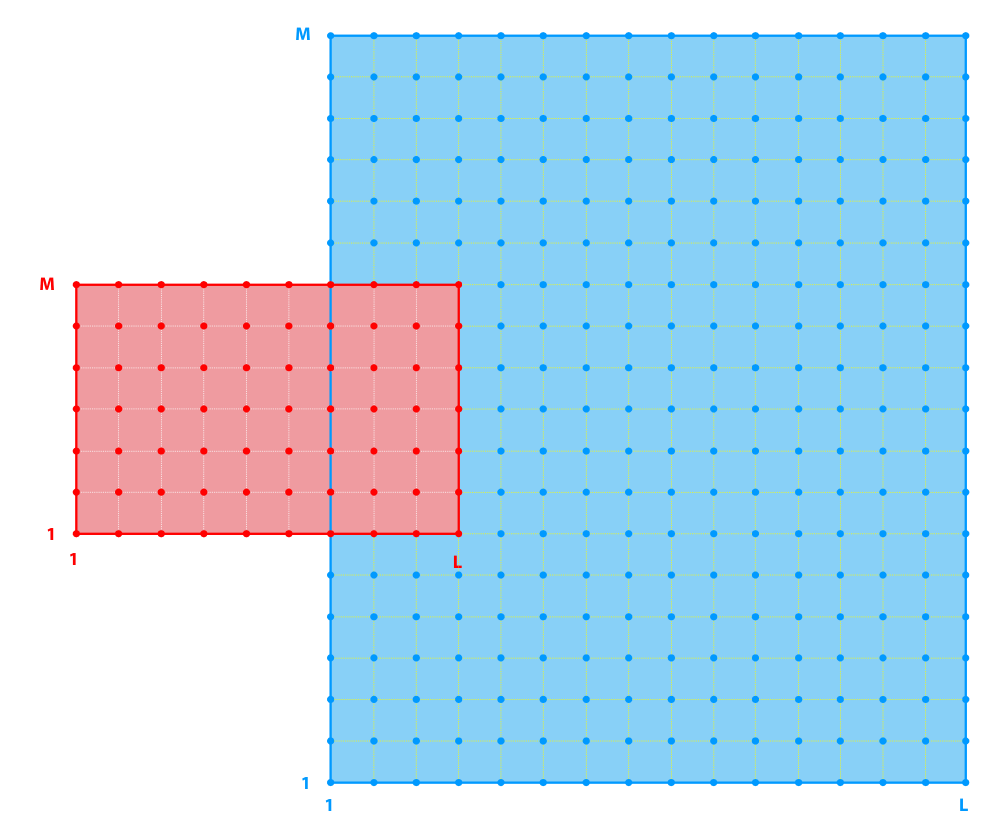
| 13:10, 1 April 2008 | composite.png (file) |  |
61 KB | Robertson | 1 | |
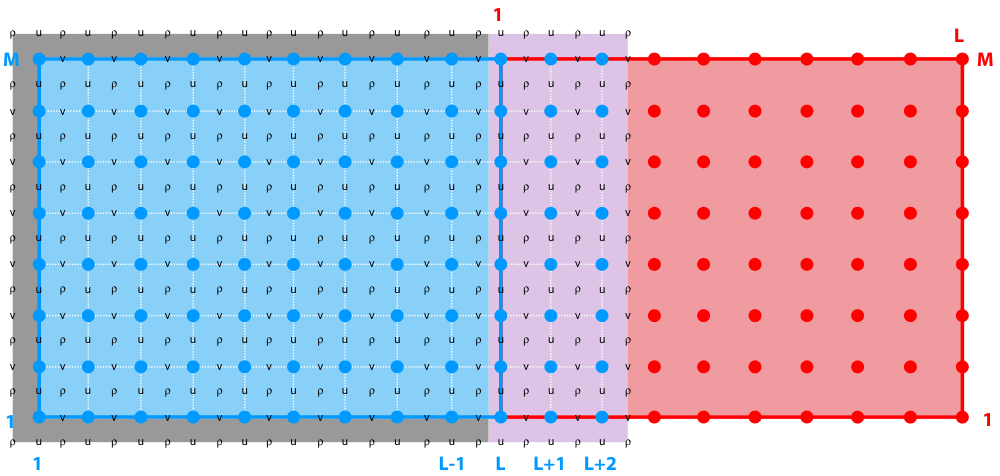
| 13:07, 1 April 2008 | mosaic grid1.png (file) |  |
43 KB | Robertson | 1 | |
| 13:07, 1 April 2008 | mosaic grid2.png (file) |  |
45 KB | Robertson | 1 | |
| 13:05, 1 April 2008 | mosaic.png (file) |  |
37 KB | Robertson | 1 | |
| 13:01, 1 April 2008 | refinement grid2.png (file) |  |
88 KB | Robertson | 1 | |
| 12:58, 1 April 2008 | refinement grid1.png (file) |  |
86 KB | Robertson | 1 | |
| 12:56, 1 April 2008 | refinement.png (file) |  |
21 KB | Robertson | 1 | |
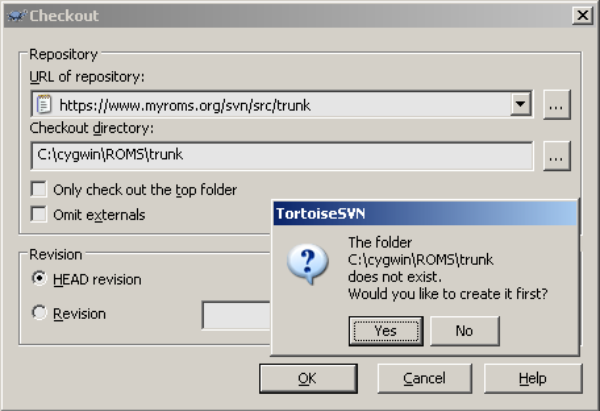
| 11:50, 28 March 2008 | tortoise co1.png (file) |  |
52 KB | Robertson | 1 | |
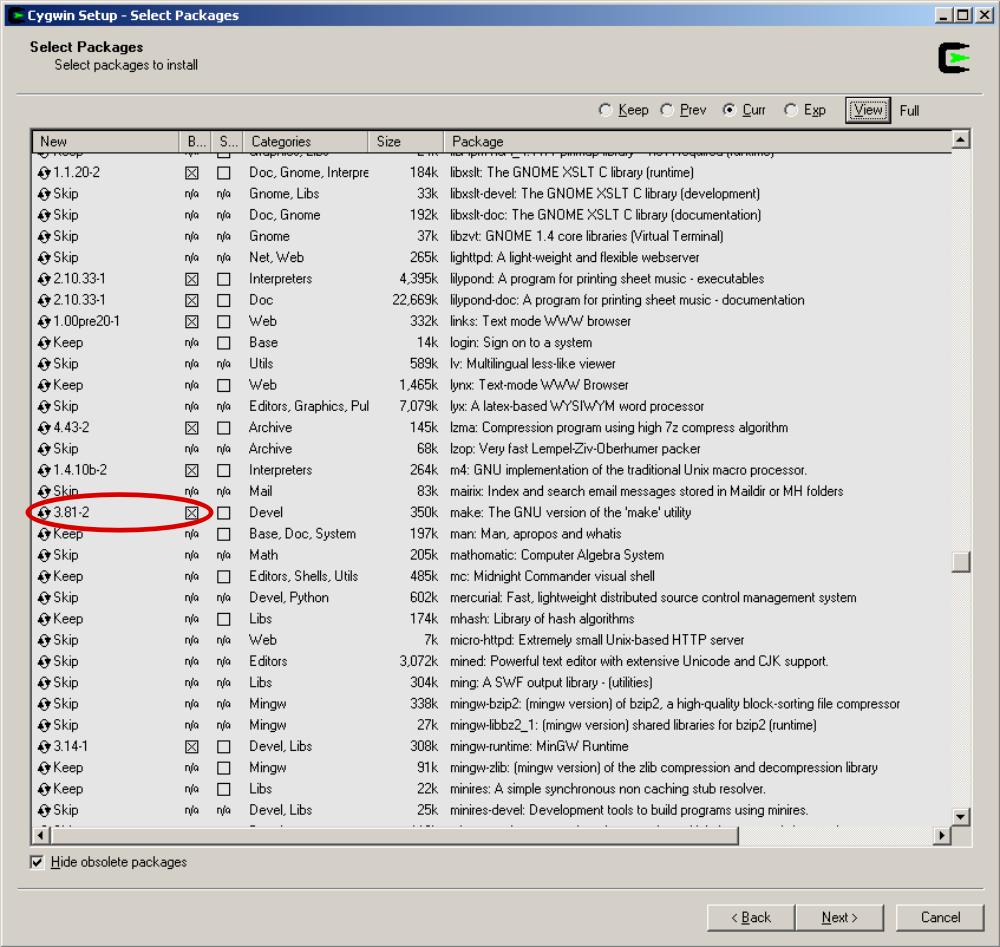
| 18:45, 27 March 2008 | cygwin make.png (file) |  |
260 KB | Robertson | 1 | |
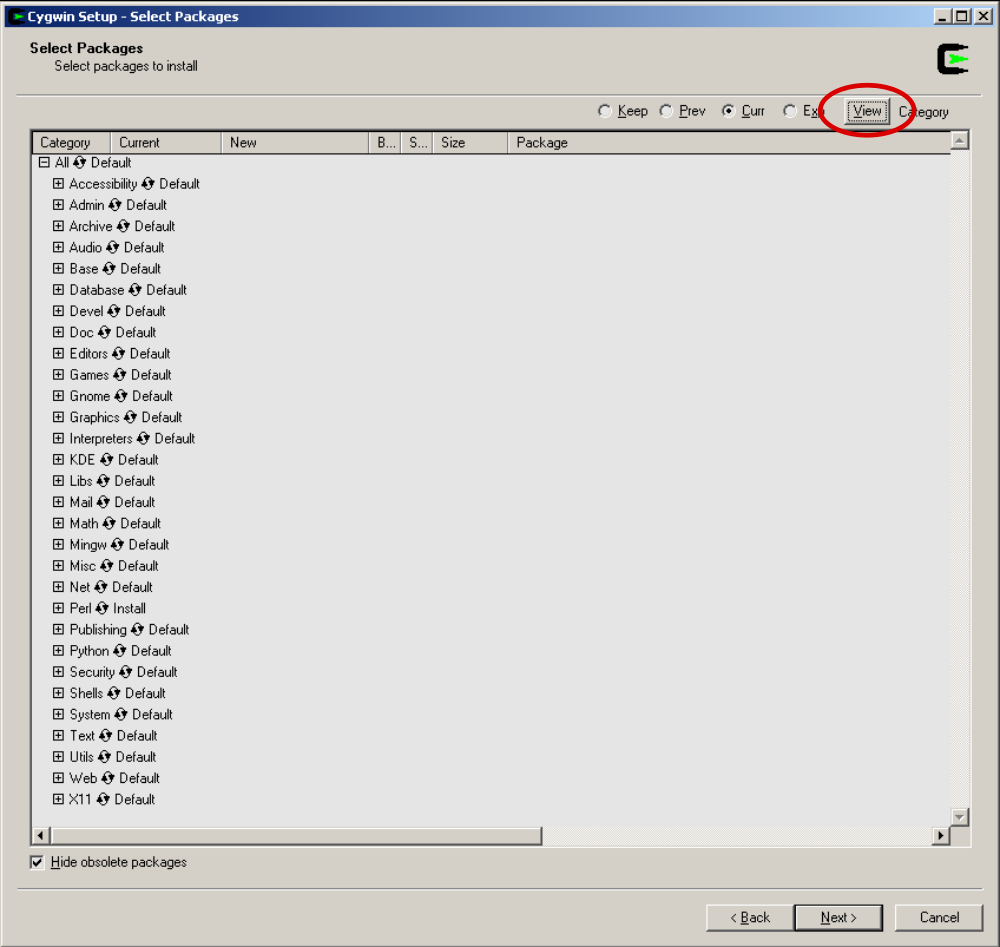
| 18:38, 27 March 2008 | cygwin view.png (file) |  |
137 KB | Robertson | 1 | |
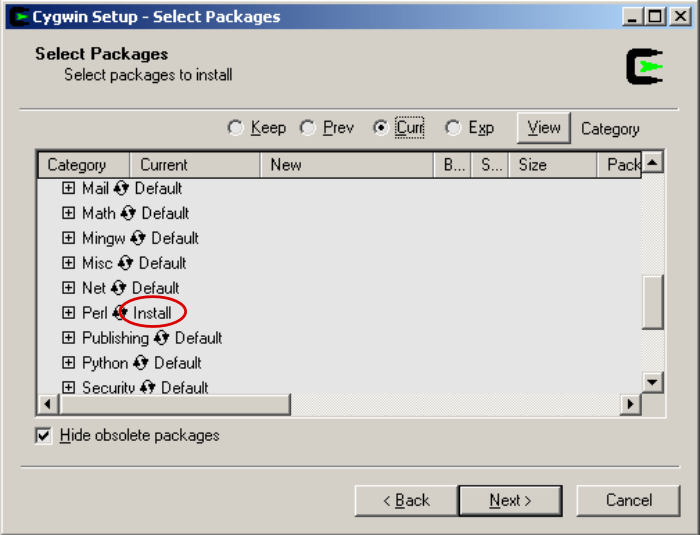
| 17:35, 27 March 2008 | cygwin perl.png (file) |  |
86 KB | Robertson | 1 | |
| 18:04, 20 March 2008 | adjoint communications NS.png (file) |  |
28 KB | Robertson | North-South adjoint model communication diagram. | 1 |
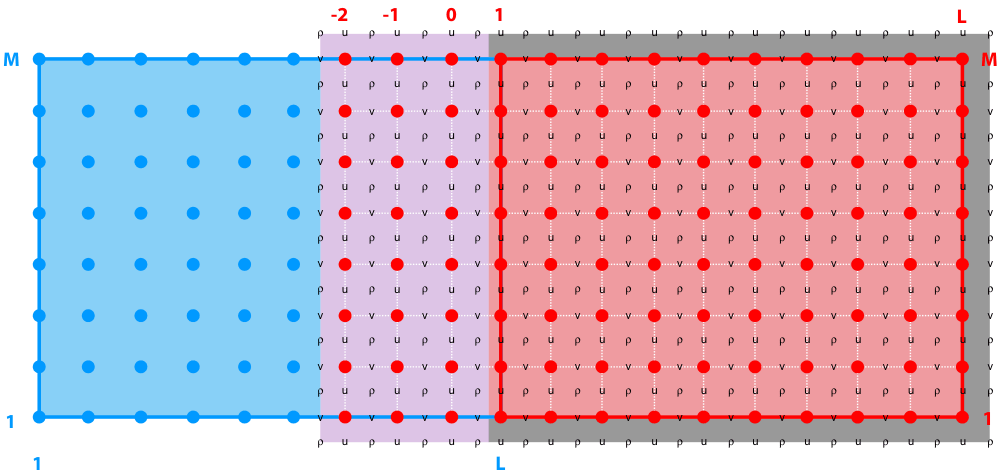
| 18:03, 20 March 2008 | communications NS.png (file) |  |
27 KB | Robertson | North-South forward model communication diagram. | 1 |
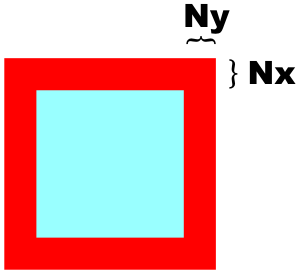
| 18:37, 19 March 2008 | tile.png (file) |  |
3 KB | Robertson | Single tile schematic. | 1 |
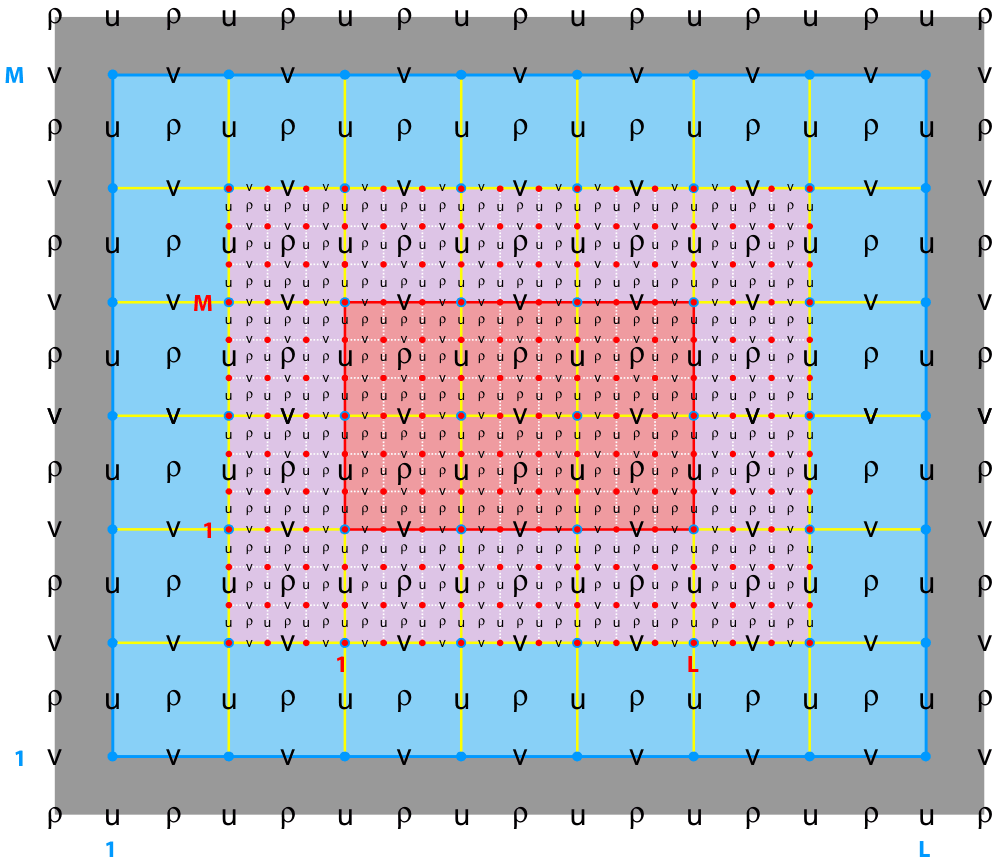
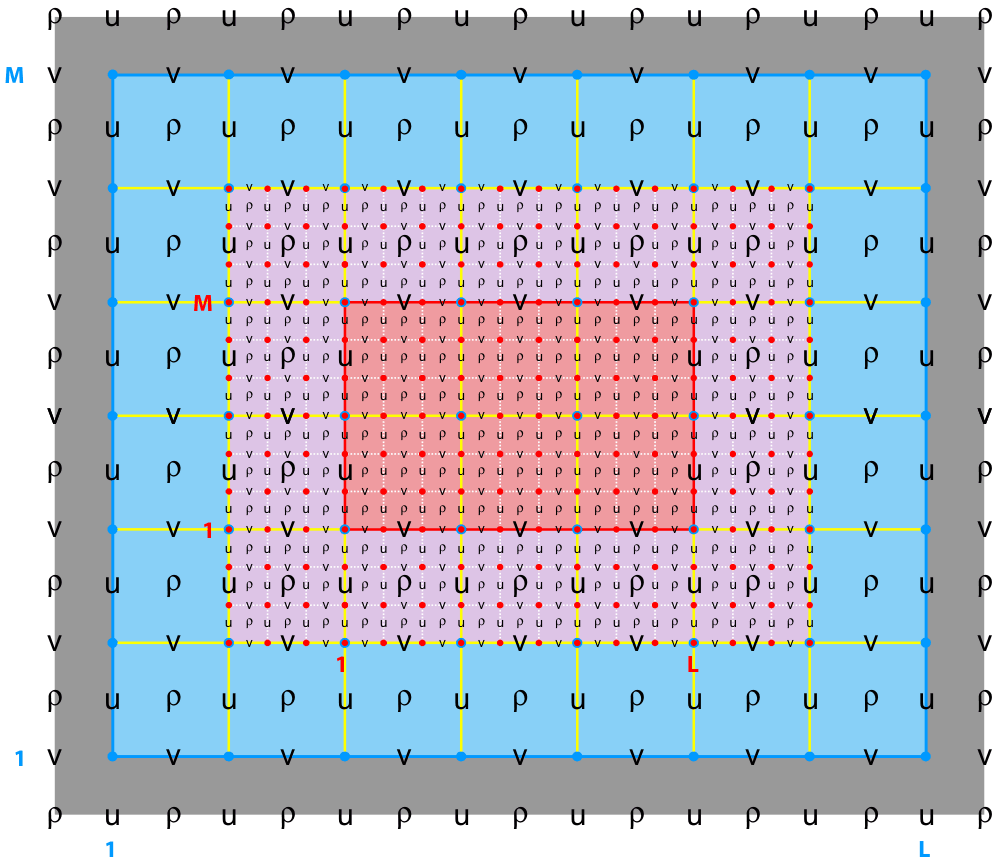
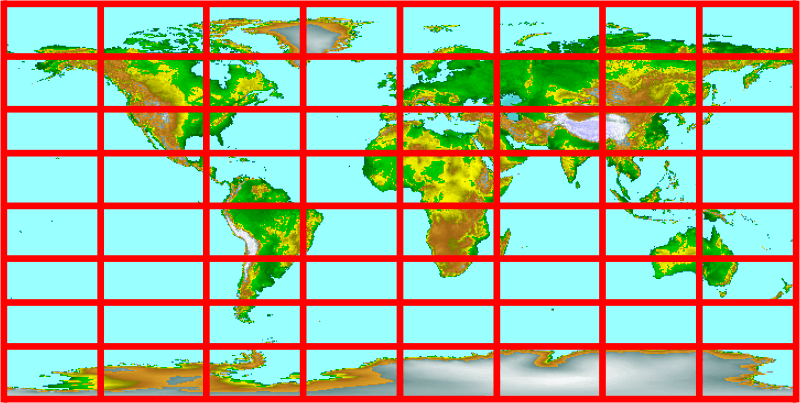
| 18:28, 19 March 2008 | parallel tile map.png (file) |  |
79 KB | Robertson | Parallel Tiling Map | 1 |
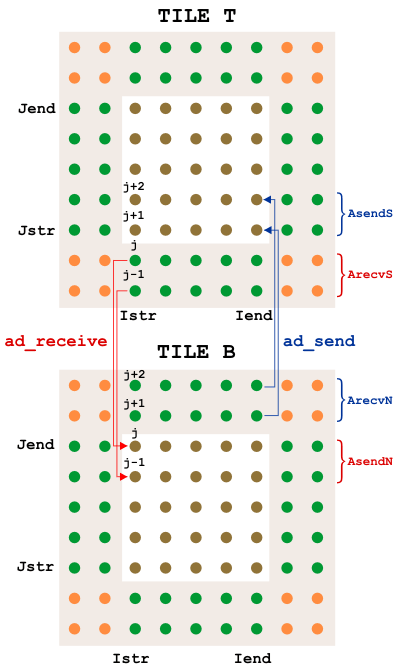
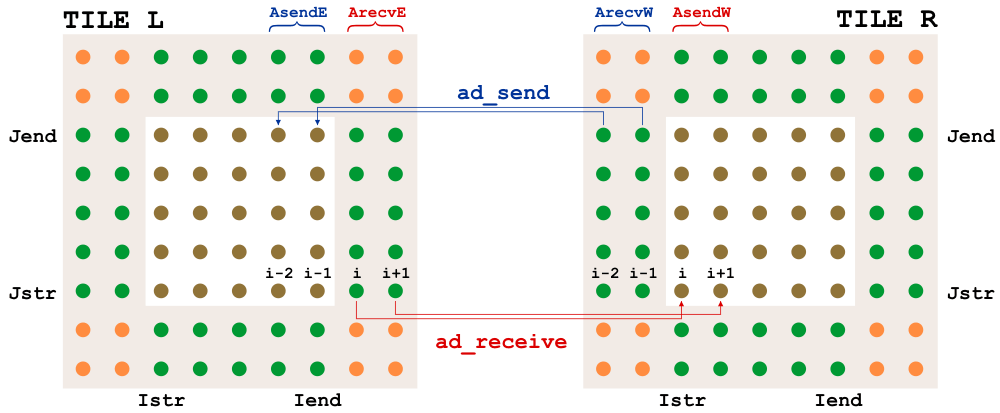
| 13:34, 13 March 2008 | adjoint communications.png (file) |  |
36 KB | Robertson | This figure illustrates how the ROMS adjoint model communications work. | 1 |
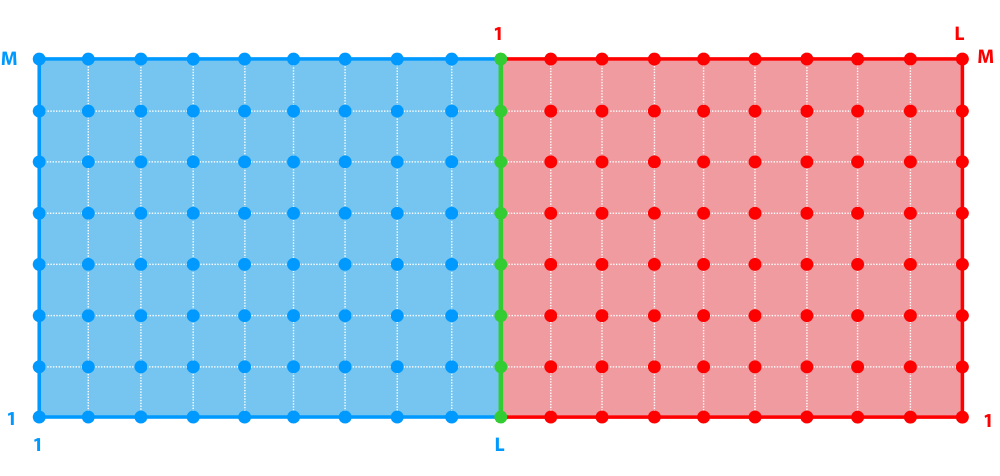
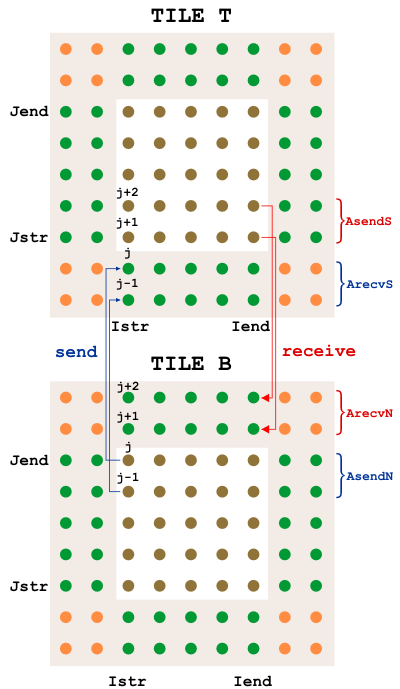
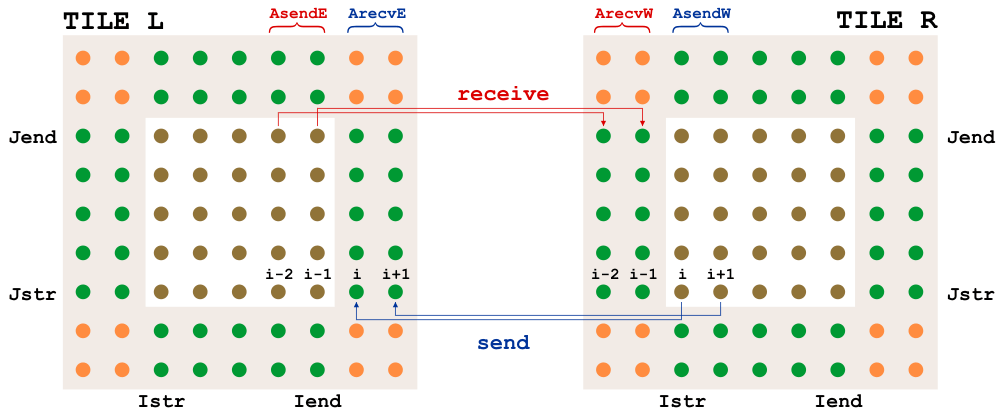
| 13:30, 13 March 2008 | communications.png (file) |  |
35 KB | Robertson | This figure illustrates how ROMS forward model communications work. | 1 |
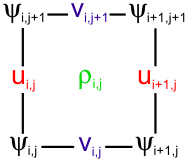
| 13:14, 13 March 2008 | grid cell.png (file) |  |
4 KB | Robertson | Horizontal variable placement on ROMS grid. | 1 |
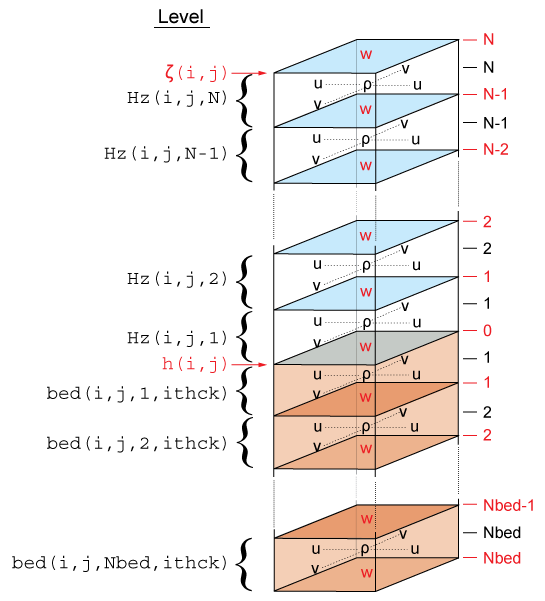
| 20:19, 7 March 2008 | vertical grid.png (file) |  |
18 KB | Robertson | 1 | |
| 19:03, 3 March 2008 | upwelling velmag temp.gif (file) |  |
31 KB | Robertson | Plot of temperature with velocity magnitude overlay. | 1 |
| 19:39, 29 February 2008 | vieste-dubrovnik.png (file) |  |
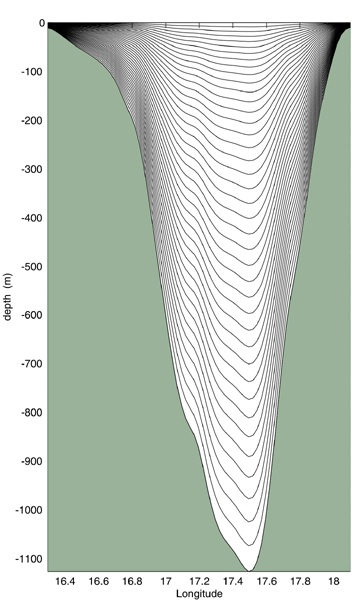
57 KB | Robertson | This is a plot of the vertical cross-section from Vieste, Italy to Dubrovnik, Croatia with a stretched s-coordinate system overlay. | 1 |
| 19:36, 28 February 2008 | staggered grid rho cells.png (file) |  |
45 KB | Robertson | 1 | |
| 18:14, 25 February 2008 | staggered grid v cells.png (file) |  |
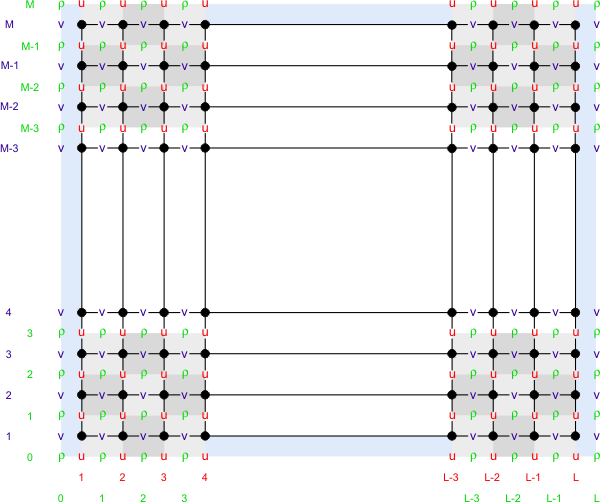
25 KB | Robertson | This image illustrates the ROMS staggered grid with respect to v points. | 1 |
| 18:11, 25 February 2008 | staggered grid u cells.png (file) |  |
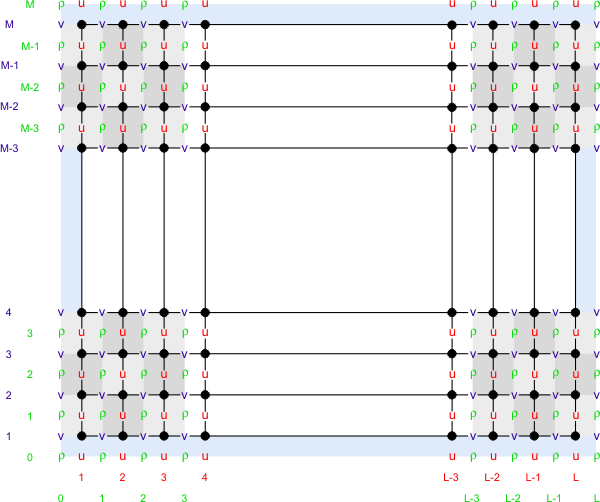
24 KB | Robertson | This image illustrates the ROMS staggered grid with respect to rho points. | 1 |