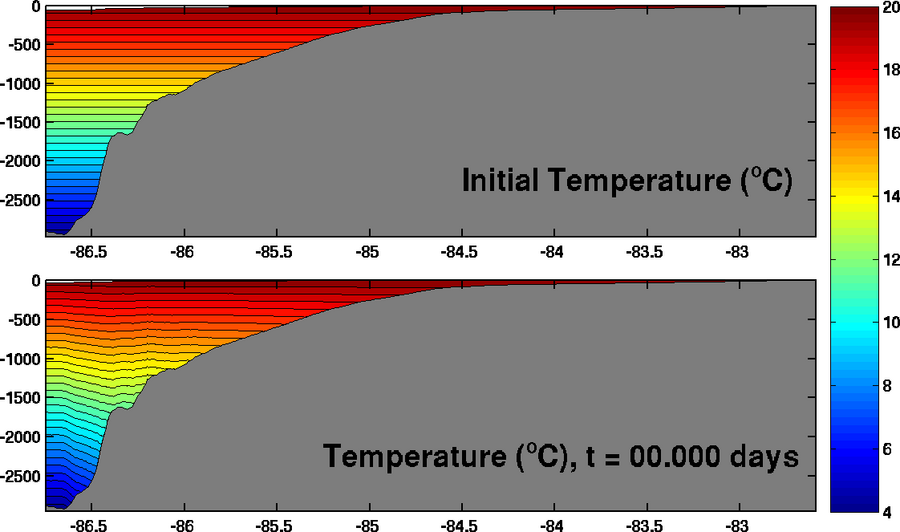
What I find is that, when plotting a cross-section of the temperature contours from the first history file (his_0001.nc), my isopycnals are not flat. Looking at the code, it appeared that the initial history file should be exactly the initial condition. However, upon plotting a comparison of the the two, this is not the case:

It looks like the model computes some diagnostics, such as KE, PE, volume, etc., but I didn't seem clear to me if any of the initial 3d fields are updated before the first output (esp. since KE is zero):
Code: Select all
   STEP   Day HH:MM:SS  KINETIC_ENRG   POTEN_ENRG    TOTAL_ENRG    NET_VOLUME

      0     0 00:00:00  0.000000E+00  2.810623E+03  2.810623E+03  1.151972E+13
      DEF_HIS   - creating history file: his_0001.nc
      WRT_HIS   - wrote history  fields (Index=1,1) into time record = 0001

